About 19669247

Things Happen though We Can Be Prepared!

As I write this, my power just flickered off / on. The wind is a-hollering….

We see and hear about it all the time. We know disaster can strike at any time. Natural disasters are happening more and more frequent. It’s important to be ready. Take a few hours this season to gather important documents and personal supplies.

CLICK HERE to download our Emergency Preparedness Kit Checklist.

As you enjoy searching for those deals on Cyber Monday, order a few extra items for your Kit. You never know when you will need it!

Until next time, make it a good one! – Bob

Best States to Survive a Recession in 2020

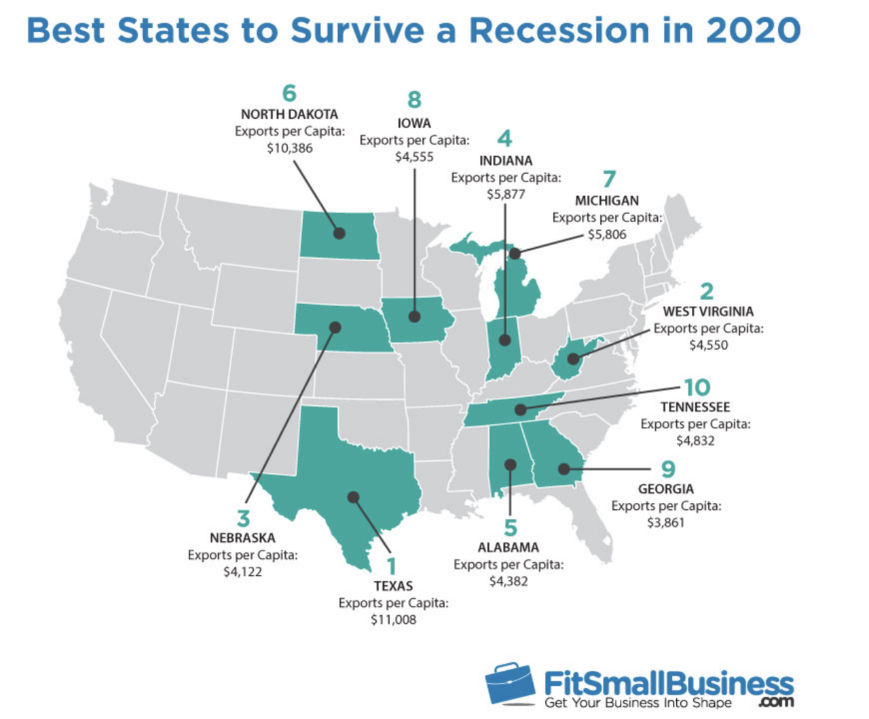
With the talk of a looming 2020 recession, I recently came across this article that I found quite interesting.

Fit Small Business just released the results of its 2019 study that dug into national and state-based economic data to rank each state on how best equipped they were to survive a recession in 2020. All of them boast business diversity and minimal per-capita debt, but the changes over the last two years were remarkable.

Here’s what they said about our beautiful state of Indiana.

“Indiana is No. 4 in our recent 2019 study from Fit Small Business, up from the 10th position in 2017. Indiana’s debt-to-income ratio dropped from 1.34 in 2017 to 1.165 in 2019, while its GDP grew from $273 billion in 2008 to $367 billion in 2019. Indiana also has the eighth-highest exports per capita at $4,122.

The real estate market has also evolved in Indiana since 2017 with a drop in median home value from $186,000 to $147,000 in 2019. While this indicates a drop in demand, it also suggests more affordable housing for residents—key for those who want to get back on their feet after a hard-hitting recession. Last, but certainly not least, Indiana boasts a low income tax rate of 3.23%—the nation’s fourth lowest.”

This is excellent news for the real estate market in Indiana! So if you are thinking of buying/selling, it may be the right time for you. Give me a call at 317-625-0655.

Want to dive deeper into the study? The following 11 metrics were analyzed and compared to their 2017 study. The full report can be found here 

• Stabilization (aka surplus or emergency) funds available (15%)
• Economic strength and diversity (15%)
• Debt-to-income ratio (10%)
• Unemployment rate (10%)
• Median home value (10%)
• Exports per capita (10%)
• Export diversity (10%)
• Deposits per capita (7.5%)
• Average credit card debt (5%)
• State income tax rate (5%)
• 2008 recession performance (2.5%)

Until next time, make it a great day!

What’s the Truth about Credit Scores

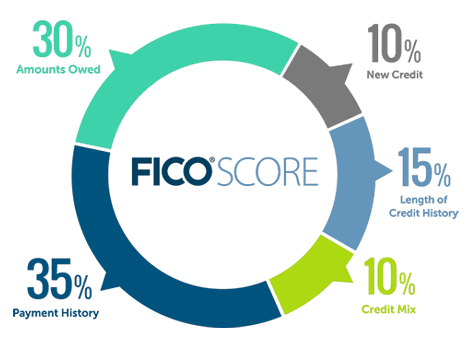
There are a lot of misconceptions about credit scores. Do you know the 5 things that matter?

Payment history (35%) – This is your track record of paying back what you borrowed. Accounts in collection, late payments, and bankruptcy are bad; paying on time for a long period is good

Amounts owed (30%) – This is based on the total amounts you owe, and the ratio of what you’re allowed to borrow to what you currently owe, called your “utilization ratio.” Maxing out your credit hurts it; keeping a lot of unused credit available helps it.

Length of credit history (15%) – This considers the length of time each credit account has been open, and when each account was last updated with payment or usage info. Credit accounts with “gray hair” are a plus.

New credit (10%) – This includes recent inquiries and requests for credit. Regularly applying for new credit cards or other loans will cost you.

Types of credit used (10%) – There are all kinds of credit out there, from revolving (credit cards) to installment (car and home loans.)

Want to know a bit more…Check out this great article I came across – Click Here

With over thousands of transactions, we have learned a thing or two, and we work harder to make sure that those lessons learned work to your benefit. So, give me a call at 317-625-0655 when the time is right.